Time series statistics
Library of often used functions for evaluating properties of time series or
data arrays. See also Normalization.
correl(vars Data, int Length, function): var
Spearman correlation of the Data series with an arbitrary
function. Used for the CTI,
CCYI, and CCYIR indicators. Source in
indicators.c; usage and description on
Financial Hacker.
Correlation(vars Data1, vars Data2, int TimePeriod): var
Pearson's correlation coefficient between two data series over the given
TimePeriod, in the range between -1..+1. A coefficient
of +1.0, a "perfect positive correlation," means that changes in
Data2 cause identical changes in Data1 (e.g.,
a change in the indicator will result in an identical change in the asset price).
A coefficient of -1.0, a "perfect negative correlation," means that changes
in Data2 cause identical changes in Data1, but
in the opposite direction. A coefficient of zero means there is no relationship
between the two series and that a change in Data2 will have no
effect on Data1. This function can be also used to get the autocorrelation
of a series by calculating the correlation coefficient between the original series
and the same series lagged by one or two bars (series+1 or
series+2).
Covariance(vars Data1, vars Data2, int TimePeriod): var
Covariance between two data series. Can be used to generate a covariance matrix
f.i. for the markowitz efficient frontier calculation.
Fisher(vars Data): var
Fisher Transform; transforms a normalized Data series to a normal
distributed range. The return value has no theoretical limit, but most values are
between -1 .. +1. All Data values must be in the
-1 .. +1 range, f.i. by normalizing with the AGC,
Normalize, or cdf function. The minimum
Data length is 1; a single var
can be passed with the & operator, f.i.
Fisher(&MyVariable). Source in
indicators.c.
FisherInv(vars Data): var
Inverse Fisher Transform; compresses the Data series to be between
-1 and +1. The minimum length of the Data
series is 1; a single var can be passed with
the & operator, f.i. FisherInv(&MyVariable). Source
in indicators.c.
FisherN(vars Data, int TimePeriod): var
Fisher Transform with normalizing; normalizes the Data series with
the given TimePeriod and then transforms it to a normal distributed
range. Similar to a Normalize filter (see below), but more selective
due to the normal distribution of the output. The return value has no theoretical
limit, but most values are in the -1.5 .. +1.5 range. The minimum
length of the Data series is equal to TimePeriod.
The function internally creates series (see remarks). Source code in indicators.c.
FractalDimension(vars Data, int TimePeriod): var
Fractal dimension of the Data series; normally 1..2.
Smaller values mean more 'jaggies'. Can be used to detect the current market regime
or to adapt moving averages to the fluctuations of a price series. Requires a lookback
period of twice the TimePeriod. Source in indicators.c.
Gauss(vars Data, int TimePeriod): var
Gauss Filter, returns a weighted average of the data within the given time period,
with the weight curve equal to the Gauss Normal Distribution. Useful for removing
noise by smoothing raw data. The minimum length of the Data series
is equal to TimePeriod, the lag is half the TimePeriod.
Source in indicators.c.
Hurst (vars Data, int TimePeriod): var
Hurst exponent of the Data series; between 0..1.
The Hurst exponent measures the 'memory' of a series. It quantifies the autocorrelation,
i.e. the tendency either to revert to the mean (Hurst < 0.5)
or to continue trending in a direction (Hurst > 0.5). This way
the Hurst exponent can detect if the market is in a trending state. The
TimePeriod window (minimum 20) must have sufficient length
to catch the long-term trend; the lookback period must be at least twice the TimePeriod.
The function internally creates series (see remarks). Source in indicators.c.LinearReg(vars Data, int TimePeriod): var
Linear Regression, also known as the "least squares moving average"
(LSMA). Linear Regression attempts to fit a straight trendline between several
data points in such a way that the distance between each data point and the trendline
is minimized. For each point, the straight line over the specified previous bar
period is determined in terms of y = b + m*x, where y
is the price and x the bar number starting at
TimePeriod bars ago. The formula for calculating b and
m is then
m = (nΣxy - ΣxΣy) / (nΣx² - (Σx)²)
b = (Σy - bΣx)
/ n
where n is the number of data points (TimePeriod)
and Σ is the summation operator. The LinearReg function returns b+m*(TimePeriod-1),
i.e. the y of the current bar.
Source
in ta-lib.zip. For higher order regression or for evaluating
the regression value at past or future bars, use polyfit / polynom. For logistic
regression with multiple variables, use the advise(PERCEPTRON,...).
LinearRegAngle(vars Data, int TimePeriod): var
Linear Regression Angle. Returns m converted
to degrees. Source in ta-lib.zip. Due to the arbitrary x and y units of a price chart, the angle
is a mostly useless parameter, although held in high esteem by Gann believers.
LinearRegIntercept(vars Data, int TimePeriod): var
Linear Regression Intercept. Returns b.
Source in ta-lib.zip.
LinearRegSlope(vars Data, int TimePeriod): var
Linear Regression Slope. Returns m as data difference per bar. Source
in ta-lib.zip.
MatchIndex(vars Data, var Reference, int Period): int
Index of the Data value
closest to Reference over the specified Period. 0 =
best match is at current bar, 1 = at one bar ago, and so on. If the
Data series
was shifted (+N), add the offset N to
the returned index for getting the number of bars passed since the best match.
Source in indicators.c.
MaxIndex(vars Data, int Period): int
Index of highest Data value over the specified Period.. 0 = highest value
is at current bar, 1 = at one bar ago, and so on. If the series
was shifted (+N), add the offset N to
the returned index for getting the number of bars passed since the lowest
Data value. Source in
ta-lib.zip.
MaxVal(vars Data, int Period): var
Highest Data value over the specified Period.
Source in ta-lib.zip.
Median(vars Data, int Period): var
Median Filter; sorts the elements of the Data series and returns
their middle value within the given Period. Useful for removing noise spikes
by eliminating extreme values. The minimum length of the Data series
is equal to Period, the lag is half the Period.
Source in ta-lib.zip. See also Percentile.
MinIndex(vars Data, int Period): int
Index of the lowest value over a specified period; 0 = lowest value
is at current bar, 1 = at one bar ago, and so on. If the series
was shifted (+N), add the offset N to
the returned index for getting the number of bars passed since the lowest
Data value.
Source in ta-lib.zip. MinVal(vars Data, int Period): var
Lowest value over a specified period. Source
in ta-lib.zip.
MinMax(vars Data, int Period): var
Lowest and highest values over a specified period. Result in rMin, rMax.
Source in ta-lib.zip.
MinMaxIndex(vars Data, int Period): int
Indexes of lowest and highest values over a specified period. Result in rMinIdx,
rMaxIdx. 0 = current bar, 1 = one bar ago,
and so on. Source in ta-lib.zip.
Mode(vars Data, int TimePeriod, int Steps): var
Most frequent Data value within TimePeriod. For
this the Data range is divided into Steps separate
ranges, and the number of values that fall into a range is counted. The function
returns the value with the highest count.
Source in indicators.c.
Moment(vars Data, int TimePeriod, int N): var
The statistical moment N (1..4) of the
Data series section given by TimePeriod. The first moment
is the mean, second is variance, third is skewness, fourth ist kurtosis.
The standard deviation is the square root of the second moment. The mean is
stored in rMean. See also SemiMoment. Source
in indicators.c.NumAbove(vars Data, int Length, var Theshold): var
Number of Data elements above the given
Threshold within the Length, from
0 to Length. Source in indicators.c.
NumInRange(vars Low, vars High, var Min, var Max, int Length): var
Number of data ranges, given by their Low and
High values, that lie completely inside the interval from
Min to Max within the given Length.
Can be used to calculate the distribution of prices or candles. Low
and High can be set to the same value for counting
all values in the interval, or swapped for counting all candles that touch the interval.
Returns a value of 1..Length. Source in indicators.c.
See also PercentRank.
NumRiseFall(vars Data, int TimePeriod): var
Length of the last streak of rising or falling values in the Data
series, back to the given TimePeriod. For a rising sequence its
length is returned, for a falling sequence the negative length (f.i. -3
when Data[3] < Data[2] > Data[1] > Data[0]). Range:
1..TimePeriod-1. See the RandomWalk
script for an example. Source in indicators.c.
NumUp(vars Data, int TimePeriod, var Theshold): var
NumDn(vars Data, int TimePeriod, var Theshold): var
Number of upwards or downwards Data changes by more than the given
Threshold within the TimePeriod, from
0 to TimePeriod-1. See also SumUp,
SumDn. Source in indicators.c.
Percentile(vars Data, int Length, var Percent): var
Returns the given percentile of the Data series with given
Length; f.i. Percent = 95 returns the
Data value that is above 95% of all other values. Percent = 50
returns the Median of the Data series.
PercentRank(vars Data, int Length, var Value): var
The opposite of Percentile: Returns the percentage of Data
values within the given Length that are smaller or equal than the
given Value; returns 100 when Value is the greatest
in the data range. Can transform any series to a range of 0..100. See also
NumInRange.
R2(vars Data, int Length): var
Coefficient of determination (+1...-1); similarity of the Data
series with a straight line through its end points. At 1 the
data series is equivalent to a straight line, at 0 or below
even the mean of the data is a better fit to the straight line than the real
data series.
SemiMoment(vars Data, int TimePeriod, int N): var
The statistical moment N (1..4) of the
Data series section given by TimePeriod, using only
data points at or below the mean. The first moment
is the mean, the second is the semivariance, third is downside skew, and fourth is
downside kurtosis.
The mean is stored in rMean. The semideviation
(downside deviation) is the square root of the semivariance, and is often
considered a better measure of risk than the standard deviation. See also
Moment. Source in indicators.c.
ShannonGain(vars Data, int TimePeriod): var
Expected logarithmic gain rate of the Data series in the range
of about +/-0.0005. The gain rate is derived from the Shannon probability
P = (1 + Mean(Gain) / RootMeanSquare(Gain)) / 2, which is the likeliness
of a rise or fall of a high entropy data series in the next bar period. A positive
gain rate indicates that the series is more likely to rise, a negative gain rate
indicates that it is more likely to fall. The zero crossover could be used for a
trade signal. Algorithm by John Conover. Source in
indicators.c.
ShannonEntropy(vars Data, int Length, int PatternSize): var
Entropy of patterns in the Data series, in bit; can be used to
determine the 'randomness' of the data. PatternSize (2..8) determines
the partitioning of the data into patterns of up to 8 bit. Each Data
value is either higher than the previous value, or it is not; this is a binary information
and constitutes one bit of the pattern. The more random the patterns are distributed,
the higher is the Shannon entropy. Totally random data has a Shannon entropy identical
to the pattern size. Algorithm explained on the
Financial Hacker blog; source in indicators.c.
Spearman(vars Data, int TimePeriod): var
Spearman's rank correlation coefficient; correlation between the original
Data series and the same series sorted in ascending order within
TimePeriod (1..256). Returns the similarity to
a steadily rising series and can be used to determine trend intensity and turning
points. Range = -1..+1, lag = TimePeriod/2. For
usage and details, see Stocks & Commodities magazine 2/2011. Source in indicators.c.
StdDev(vars Data, int TimePeriod): var
Standard Deviation of the Data series in the time period, from
the ta-lib; accuracy = 0.0001. For long time
periods, higher accuracy, or for downside deviation, use the square root of the second
Moment or SemiMoment.
Sum(vars Data, int Length): var
Sum of all Data elements up to the given Length.
Source in ta-lib.zip.
SumUp(vars Data, int Length): var
SumDn(vars Data, int Length): var
Sum of all upwards or downwards Data changes up to the given
Length. See also NumUp, NumDn. Source
in indicators.c.
SumSq(vars Data, int Length): var
Sum of the squares of all Data elements up to the given Length.
Source code in indicators.c.
TSF(vars Data, int TimePeriod): var
Time Series Forecast. Returns b + m*(TimePeriod), the Linear Regression
forecast for the next bar.
Variance(vars Data, int TimePeriod): var
Variance of the Data series in the time period, accuracy = 0.0001. Source in
ta-lib.zip. For long time
periods, higher accuracy, or for downside variance, use the second
Moment or SemiMoment.
Standard parameters:
| TimePeriod |
The number of bars for the time period of the function, if any; or
0 for using a default period. |
| Length |
The length of the Data series. |
| Data |
A data series, in reverse time order,
usually derived from
the price functions price(), priceC()
etc.. Alternatively a user created series or any other double float
array with the given minimum length can be used. If not mentioned
otherwise, the minimum length of the Data
series is TimePeriod. Some functions require a second data
series Data2. |
Usage example:
Volatility(Prices,20) calculates the standard volatility of a daily
price series over the last 20 days.
Remarks:
- The TA-Lib function prototypes are defined in include\functions.h.
The C source
code of all included TA-Lib indicators is contained in Source\ta_lib.zip
and can be studied for examining the algorithms. Some TA-Lib indicators that
originally didn't work properly - such as Correlation or SAR - have been replaced
by working versions. The C source code of most additional indicators that are
not part the the TA-Lib is contained in Source\indicators.c.
- TA-Lib indicators can only be used between INITRUN
and EXITRUN, since TA-Lib and series management are released at end of the
session. This restriction does not apply when the
STRAIGHT flag is set.
- TimeFrame affects subsequent data
series and thus also affects all indicators that use
the data series as input. The TimePeriod is then not in Bar
units, but in time frame units. TimeFrame has no effect on
indicators that do not use data series.
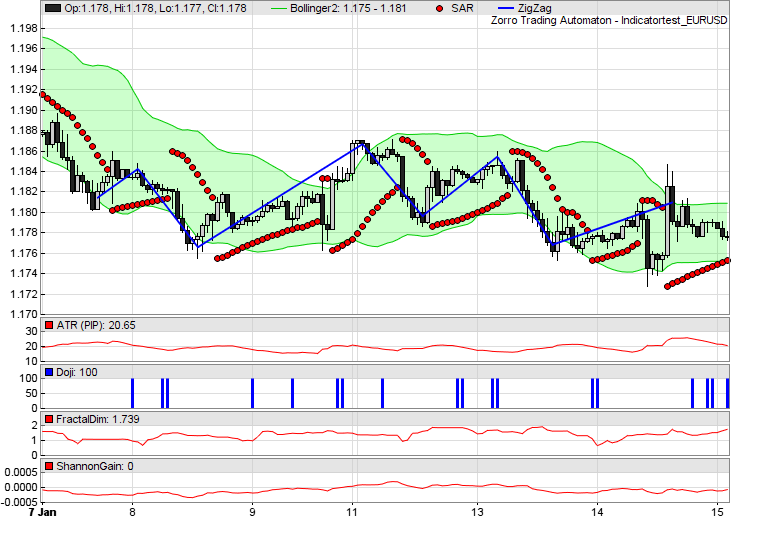
Examples:
// plot some indicators
function run()
{
  set(PLOTNOW);
  var* Price = series(price());

// plot Bollinger bands
  BBands(Price,30,2,2,MAType_SMA);
  plot("Bollinger1",rRealUpperBand,BAND1,0x00CC00);
  plot("Bollinger2",rRealLowerBand,BAND2,0xCC00FF00);
  plot("SAR",SAR(0.02,0.02,0.2),DOT,RED);
  ZigZag(Price,20*PIP,5,BLUE);

// plot some other indicators
  plot("ATR (PIP)",ATR(20)/PIP,NEW,RED);
  plot("Doji",CDLDoji(),NEW+BARS,BLUE);
  plot("FractalDim",FractalDimension(Price,30),NEW,RED);
  plot("ShannonGain",ShannonGain(Price,40),NEW,RED);
}
See also:
Spectral filters, indicators,
normalization, candle patterns,
machine learning
►
latest version online